
 Videos and slides from the conference have been uploaded. Check the agenda/session detail page. If you like what you see and you're not yet a member of the NYS GIS Association, please JOIN. It's only $10.
Mobile Mapping Session
Broadway 1 & 2
Facilitator: John Barge, NYS Adirondack Park Agency
ArcGIS Collector App for Stormwater Phase II Inspections
Presenter: Daniel Allen, GISP, MRB Group
Daniel Allen is a Senior GIS Analyst with the MRB Group, where he has worked since 2001. He is the technical lead in charge of overseeing GIS related projects with MRB Group’s existing client list of nearly 100 municipalities. He has been a member of the GIS-SIG Board of Directors since 2004, and currently serves as Vice President.
Mr. Allen has been the instructor of the Advanced GIS class at SUNY Geneseo since 2010. He earned his Bachelor of Science Degree in Environmental Management and Technology from the Rochester Institute of Technology in 2000, and his GISP certification in 2008.
Abstract
 MRB Group assisted the Town of Ontario (Wayne County, NY) with the completion of its 2013 Stormwater Phase II inspections. Instead of using paper forms, the Town leveraged its investment in GIS outfall mapping and combined it with ArcGIS Online, and the ESRI Collector App to complete the inspections digitally with smartphone devices. Digital photos of every outfall were also taken with the Collector App and automatically attached to the inspection points. The reporting functions of ArcGIS 10.1 desktop software was then used to generate an automatic paper report for every inspection with the attached photo displayed.
This presentation will cover a technical overview of the process used, in addition to considerations for planning future projects of this type.
Field Data Collection Using Smart Phones, Tablets, and GPS Devices:
A Case Study
Dr. Mix is an Associate Professor in Geography and Planning at Buffalo State College where she teaches introductory and advanced GIS courses, Urban Applications of GIS, and Interactive and Web-based mapping.
Dr. Mix has Ph.D. in Transportation Engineering from the University at Buffalo, Department of Civil Engineering (1987) and a M.A. in Geographic Information Systems, University at Buffalo, Department of Geography (1983). She graduated from Mount Holyoke College, Cum laude in 1981 with a double major in Mathematics & Geography.
Abstract
 The proliferation of smart phones and tablets with location finding capabilities has opened up new opportunities for collecting spatial data at relatively low cost. Trimble’s TerraFlex software and ESRI’s ArcGIS Online reflect the industry’s recognition of this trend. In addition to utilizing a devices internal GPS, these apps allow users to input location information by pointing, using a finger or a stylus, directly onto a background image, used as a spatial reference. Another advantage of using smart phones and tablets is that many people, particularly younger people, already are very familiar with their operation, especially filling in forms required by many apps to capture attribute information. This study reports on a small field data collection experiment using students in an introductory mapmaking course. Teams of students were instructed to locate ten features on campus using their finger, the smart phone’s or tablet’s internal GPS, and a handheld GPS unit. The focus of this study is to address the question about which approach is consistently more spatially accurate. After ‘cleaning’ the data, the internal device GPS was consistently the least spatially accurate. Touchscreen pointing and handheld GPS samples have lower total error, when error is measured as distance from a known location
Mobile Mapping of Greenhouse Gas Emissions
Presenters: John Monell – Conestoga-Rovers and Associates, Inc.
John Monell is a Senior GIS Project Manager with CRA’s Niagara Falls office, where he has worked since 1990. He has been involved in over 500 GIS-related projects across North America, including Site GIS Coordinator in St. Augustine, Texas, during the Space Shuttle Columbia disaster. John is active with both collecting and mapping data via GPS, iPad, and other mobile collection devices. He also manages the 3D Laser Scanning Group, and has scanned over 200 facilities ranging from petrochemical facilities to historic preservation sites. In his spare time, John is a director of the 4 time New York State Champion West Seneca Marching Band.
Abstract
 Conestoga-Rovers and Associates (CRA) has developed the specialized capability of determining area source emissions of atmospheric levels of greenhouse gases, from sources such as landfills and natural gas leaks. These determinations employ Cavity Ring Down Spectroscopy (CRDS) and mobile GIS mapping. CRDS is an analytical technique for measuring greenhouse gases, including methane, with sufficient precision to determine the contribution of individual sources within the ambient background.
CRA has assembled a mobile methane mapping van equipped with a Cavity Ring-Down Spectrometer for parts per billion-level methane measurements and sub-meter global positioning system. Additionally, van travel speed and direction and meteorological data, such as wind speed and direction, air temperature and barometric pressure, are collected. This van contains a custom data acquisition platform that integrates data from the various sensors and creates a graphic overlay on a satellite map in near real-time, which is used to locate pollutant plumes in near real-time.
Upon completion, the data is imported into various GIS applications, including ArcMap, Google Earth, and enterprise data management software. Utility companies use the data to maintain their systems. This combination of GIS and mobile mapping has proved to be a cost effective tool for the utility companies and their customers.
Deploying Esri-based Web-GIS Applications Across Multiple
Platforms and Mobile Devices
Presenter: Duncan Selwood, Latitude Geographics
Duncan Selwood is part of the Latitude Geographics Account Management team, providing creative web-mapping software solutions for Esri Web GIS based customers. Duncan has over 15 years experience in software sales working with customers in many sectors including utilities, life sciences, academia and state and local government.
Abstract
 Many organizations today are building mapping applications using ArcGIS Server and technologies like Flex, Silverlight, and JavaScript and HTML5. Historically these mapping applications only needed to be viewed on a traditional desktop, but increasingly there is demand to view them on mobile phones and tablets, using iOS, Android, and Windows Phone, using browser-based applications and native apps. With varying levels of support across these platforms for each client technology, what is the best way for GIS administrators to build applications that can be viewed cross-platform by the greatest number of people.
With growing sets of mobile users, administrators are forced to balance browser compatibility issues with limited resources to build and maintain applications from multiple software vendors. This presentation will introduce the Spatial Application Infrastructure (SAI) concept, a more efficient way to deploy mapping applications.
Historical Mapping & Feature Extraction Session
Broadway 3 & 4
Facilitator: Bill Johnson, NYS ITS
The New York Shoreline:
What do four centuries in the historic record show?
Presenter: Katherine Kiyanitsa, NYS ITS
Katherine Kiyanitsa works for the New York State ITS GIS Program Office as a GIS specialist and is involved in a variety of projects including mapping areas affected by Hurricanes Irene and Sandy in the context of historic land use, economic development, and environmental change.
Abstract
 The shoreline of New York State has changed dramatically over the past four centuries. Natural processes have shaped and shifted it. Manmade development has expanded it. Using georectified historic maps and GIS analyses, it is possible to examine these shoreline changes in detail and compare areas of change against modern events such as the Hurricane Sandy flood inundation of 2012. What does the data show? How can these types of analyses inform land use and development policy now and in the future? This discussion will focus on the geographic areas of lower Manhattan, the Rockaways Peninsula, and various points along Long Island?s south shore as it relates to New York State’s 2100 Commission and the Community Reconstruction Zone program.
Historical Map Polygon and Feature Extractor
Presenter: Mauricio Giraldo Arteaga, New York Public Library Labs
Mauricio spent the last twelve years designing and developing interaction design projects for a wide range of commercial, academic, private and public institutions. Mauricio is an Industrial Designer from Universidad de los Andes in Bogotá, Colombia where he also lectured for six years. He also holds a Master of Human-Computer Interaction from Carnegie Mellon University. He is now part of NYPL Labs, a digital innovation unit doing experiments around library collections and services based at the New York Public Library.
Abstract
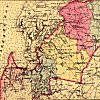 Polygon and metadata extraction from historical maps such as US insurance atlases from the 19th and early 20th centuries has so far been a manual task. The New York Public Library (NYPL) currently relies on staff and volunteer work to manually extract polygons and other metadata from its collection to create new public data sets for the study of urban history. This is a time-intensive task requiring up to several minutes to trace a shapefile and transcribe attributes for a single building. In this paper we propose an approach to automatically extract such metadata from historical maps. The approach makes use of multiple image processing and statistics utilities to produce desirable results in a fraction of the time required to do by hand.
On average, a shapefile for an atlas sheet is generated in ~11.4 minutes for a total of 23.5 hours of processing time for a whole atlas that contains ~55,000 polygons; contrast this time frame to NYPL’s current manual process that has taken three years to extract about 170,000 polygons across four New York City street atlases.
Even with some error rate in the proposed approach, the most cumbersome, time-intensive work (manual polygon drawing) has been reduced to a fraction of its original scope. This new workflow has promising implications for historical GIS.
Historical Maps, Geospatial Methods, and NYC’s Early Chemicals and
Petroleum Industries
Presenter: Peter Spellane, Chemistry Department, NYC College of Technology CUNY
Peter Spellane, Ph. D., is an associate professor and chair of the Chemistry department at New York City College of Technology where he teaches Organic Chemistry. He had studied English at Hamilton College and Chemistry at the University of Washington and at the University of California at Santa Barbara. Prior to his tenure at City Tech, he worked as a postdoctoral chemist at the IBM T. J. Watson Lab and as a research chemist at Akzo Nobel in New York and in the Netherlands. The work at Akzo Nobel led to a number of patents concerning use of conjugated polymers in coatings for metals. At City Tech he participates in several efforts that seek to integrate education in the humanities with education in science and science-based technologies. He was an investigator on several NEH-funded projects including “Water and Work: The Ecology of Downtown Brooklyn” and “Along the Shore, Changing and Preserving the Landmarks of the Brooklyn’s Industrial Waterfront.” His current research concerns the technological advances and environmental legacy of the chemicals and petroleum industries located at Newtown Creek during the late 19th and early 20th centuries, and, in applied chemistry, the preparation and characterization of energy-trapping porphyrin compounds.
Abstract
 This project examines the growth and increasing sophistication of several chemical-science-based industries at one of the country’s earliest centers for production and export of fuels and materials. Newtown Creek is a narrow but navigable channel at the center of New York City, a few minutes by water-taxi from Wall Street or midtown. To the extent that 21st century New Yorkers know of Newtown Creek, it’s as the subject of litigation in New York State courts or for recently being named an EPA Superfund site.
Insurance maps produced during the second half of the 19th century indicate locations and facilities of what were then new companies. Using tools developed and made available by the New York Public Library, we have had some success in applying geospatial methods to determine exact locations of particular producers and gaining insight into production practices. The project examines the relationships among three chemistry-intensive industries at Newtown Creek: sulfuric acid production, the electrolytic production of high purity copper metal, and the refining of petroleum. We take particular interest in the proximate locations and supplier-consumer relationships among several of Newtown Creek’s major producers and in the succession of production practices at a single site.
Maps at NYPL: Reweaving the Fabric of Historical Place
Presenter: Matt Knutzen, New York Public Library
Abstract
 As institutions of cultural heritage increasingly move their collections to the networked environment of the web, they are faced with questions about where to go next. New forms of data transcription, mashups and more sophisticated analytical tools have emerged that enable collections to be better found, used, reused, mashed, analyzed, re-purposed and in a more general sense, made more than the sum of their parts. At the Lionel Pincus and Princess Firyal Map Division of the New York Public Library, efforts are underway to not only digitize important and unique map holdings, but to georectify, create mosaic tile layers, transcribe machine readable vector spatial data, but to take those derivative data and create new experiences for the public and scholarly exploration of historical geography in the digital space, all with the help of loosely coordinated volunteers and dedicated staff members. This talk will focus on the arc of projects that make these activities possible, from foundational digitization projects to the creation of the the Map Warper (maps.nypl.org) to the implementation of a very new prototype gazetteer tool.
Environmental Session
Travers
Facilitator: Susan Nixson, City of Ithaca
Automatic Calculation of Place-Based Questions for NYS’s Newly
Updated Environmental Assessment Forms
Presenters: Austin Fisher, Fountains Spatial, Inc.
Austin Fisher is currently Vice President of Fountains Spatial, Inc. , a GIS consulting firm located in Schenectady, NY. He has over 27 years of experience as a GIS professional and has held previous positions as a Peace Corps volunteer in Mali, Director of Computer Mapping for the NYC Planning Department and Director of Data Products for MapInfo Corporation. This is a remarkable accomplishment for someone who just turned 39.
Abstract
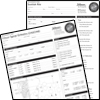 The NYS Department of Environmental Conservation recently completed a major update to the Environmental Assessment Forms (EAF). These forms are used as an integral part of the State Environmental Quality Review (SEQR) process. During the redesign of the forms, DEC recognized that a significant subset of the questions were ‘placed-based’ in nature and could be answered using GIS technology. Therefore, in conjunction with the update to the forms, DEC also implemented a web-based GIS application that allows users to define their project site and then automatically calculates answers to the placed-based questions contained with the EAFs, and populates the forms accordingly. Using this innovative approach has resulted in considerable time savings to both the applicant and reviewers, and an increased level of credability and confidence for the generated results.
This presentation will provide additional background information on the project, a review of the technical design of this system, and a live demonstration of the application.
Geospatial Analyses of Urban Drainage Network Structures and
Implications for Flood Response in the Kromma Kill Watershed
Presenter: Katherine Meierdiercks, Siena College
Abstract
 Traditionally, the percent impervious of a watershed has been the focus of examining altered flood response due to urbanization. However, other elements of the urban environment, particularly those associated with the drainage network, can also play a role in altered flood response in urban watersheds. Similarities such as Horton’s laws of stream numbers, stream lengths, and basin area can be observed in the drainage networks of all natural river basins and these geomorphic properties can be used to predict flood response. Recent research focused on urban drainage systems suggests that geomorphic properties of urban drainage systems can also impact flood response. In this study, GIS analyses are used to identify the geomorphic properties of the Kromma Kill watershed, located in Albany County. Flood response is examined through observations of rainfall and runoff. Analyses suggest that rather than percent impervious coverage, other elements of the urban landscape, such as watershed topography and drainage density, impact the timing and magnitude of flood response in the subwatersheds of the Kromma Kill.
GeoWEPP I, II & III
Managing Runoff, Erosion and Sediments on Hill Slopes and Watersheds;
Assessing Structural and Non-Structural Best Management Practices
Presenters: Haoyi Xiong, University at Buffalo (SUNY)
Abstract
 The freely available Geo-spatial interface for WEPP (GeoWEPP; http://geowepp.geog.buffalo.edu/) (Renschler, 2003) utilizes digital geo-referenced information such as Digital Elevation Models (DEMs) to derive and prepare valid model input parameters and defaults to start site-specific soil and water conservation planning for representative hillslopes and small watersheds with spatially distributed soil and land use. The Water Erosion Prediction Project (WEPP) (Laflen et al., 1991; Flanagan and Nearing, 1995) model is a state-of-the-art continuous, process-based model that simulates land use and climate change scenarios for small watersheds and hillslope profiles.
I – The integration of orthophotos, soil surveys, land use maps, climate data, and precision farming data as well as multiple soil and land use within each sub-catchment is currently under development. GeoWEPP for ArcGIS 10.1 provides users with different levels of GIS knowledge to utilize the WEPP modeling capabilities with user-specific standard GIS data sources and/or through accessing commonly readily available U.S.-nationwide data sets that are free of charge. After a 20-minute WEPP/GeoWEPP introduction, the users will use the remaining time to interactively assess with the audience various soil and water conservation management options for agricultural, forest, and rangeland sites as well as construction sites under climate change scenarios.
II – After a WEPP/GeoWEPP introduction and a presentation of Structural Best Management Practices (e.g. culverts, impoundments, terraces, etc.), the users will use the remaining time to interactively assess with the audience various soil and water conservation management options for agricultural, forest, and rangeland sites as well as construction sites under climate change scenarios.
III – After a WEPP/GeoWEPP introduction and a presentation of Non-structural Best Management Practices (e.g. vegetative buffer strips, strip cropping, reforestation, etc.), the users will use the remaining time to interactively assess with the audience various soil and water conservation management options for agricultural, forest, and rangeland sites as well as construction sites under climate change scenarios.
Platinum Session
Highrock

 Bowne Management Systems, Inc. is hosting a special Hospitality Suite in Highrock on Wednesday, November 13th from 1-2:30 PM. Meet our 3 senior staff, learn about our services and how we can help you with your technology- related challenges. Join us for open Q&A, and enjoy our complimentary “Make your own ice cream sundae bar!”
Facilitator: Tom Sears, Stuben County
Presenters
Rich Annitto
Rich Annitto is the Chief Operating Officer and Executive Vice President of Bowne Management Systems, Inc., responsible for the day-to-day operations of the firm. In his 25 year career with Bowne he has led major GIS initiatives for NY State and City agencies and municipalities throughout the NY metropolitan area and upstate New York. These include NYC Citywide Street Centerline (CSCL) project, the Nassau County Enterprise GIS and Suffolk County Real Property Tax Map Conversion. Mr. Annitto holds an M.S. in Geographic Information Systems and a B.A. in Geography from the University of Connecticut. He is a member of the Urban and Regional Information Systems Association (URISA) and has presented over a dozen papers at various conferences hosted by ESRI, URISA, and other GIS industry organizations.
Jim Hall
Jim Hall, GISP is a Senior Analyst and Project Manager with Bowne Management Systems. He specializes in architecting and overseeing implementation of GIS and IT solutions, and is the practice leader for Bowne’s Business Continuity/Disaster Recovery practice. In his 20+ year career, Jim has completed projects for over 50 different government, utility and corporate customers including, most notably, the NYC Economic Development Corporation, the NYC Department of Environmental Protection, the NYC Department of Information Technology and Telecommunications, the NYS State Historic Preservation Office as well as Westchester, Orange, Ulster and Cortland Counties. He holds a B.A. in Geography from Virginia Tech, and has made over 50 presentations at industry events and conferences in five countries.
Girk Cakmak
Girk Cakmak, Managing Director of Bowne Management Systems, is responsible for business development and support of Bowne clients in the Albany/Capital Region, including State agencies and numerous upstate municipalities. Mr. Cakmak holds an M.S. in Regional Planning and a B.S. in Urban and Regional Planning from Istanbul Technical University. He also holds an M.B.A. and a Certification of Advanced Study in Planning and Policy Analysis from SUNY. Mr. Cakmak is the co-chair of Project Management Workgroup of NYS Forum and an active member of New York State GIS/LIS Association, URISA and the Project Management Institute (PMI).
About Bowne Management Systems
Ellen Sokol
235 E. Jericho Turnpike
Mineola, NY 11501 USA
Phone: 516-746-2350
Email: esokol@bownegroup.com
www.bownegroup.com
Bowne Management Systems, Inc. is a leading integrator of IT and GIS, providing consulting for GIS implementation, application development, systems integration, document management, data conversion and integration, and quality control. Bowne’s staff of over 40 professionals includes PMPs, business analysts, developers, GIS analysts, specialists and technicians. Bowne has been an Esri Business Partner since 1999.
